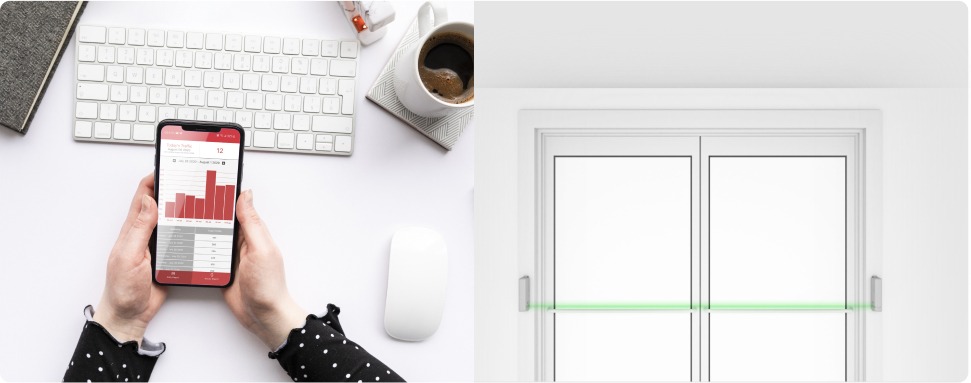
One question retailers ask when considering a traffic counting system is whether to install directional or non-directional detectors. Determining which is most appropriate depends on the value of the information, the cost of getting it, and the ROI potential. If directional counts are mission critical and provide action-able data, then this technology is appropriate. Otherwise, non-directional counts provide similar (see table below) information at a lower cost.
The majority of our clients do not count directional traffic. Why? The information of in and out traffic does not provide a substantive difference for staffing purposes and no difference for conversion or % sold. The flow of traffic in and out during the day is consistent with both directional and non directional technology.
The key question is, “what constitutes traffic?”
Is traffic the total traffic that entered the store during a given period, or the maximum, minimum, or average traffic IN the store during a given period, or an average of traffic that passed through the store during this period?
Whichever method of calculating traffic is used, the staff schedule – assuming a daily service objective of 1 staff per 10 traffic and a required minimum of 1 staff in the store — is likely to be similar no matter which count is used. Table 1 allocates staff to each 30 minute period based on traffic according to the number of IN traffic, the number of customers in store at the end of the period, and the traffic recorded by a beam technology and then divided by 2 for the same period.
| TIME | IN Counts | OUT Counts | Customer IN STORE | BEAM counts Divided by 2 | Staffing using IN counts | Staffing using Customers IN STORE | Staffing using BEAM counts Divided by 2 |
|---|---|---|---|---|---|---|---|
| 9:00 | 1 | 0 | 1 | .5 | 1 | 1 | 1 |
| 9:30 | 9 | 3 | 7 | 6 | 1 | 1 | 1 |
| 10:00 | 11 | 8 | 10 | 9.5 | 2 | 1 | 1 |
| 10:30 | 14 | 11 | 13 | 12.5 | 2 | 2 | 2 |
| 11:00 | 24 | 29 | 8 | 26.5 | 3 | 1 | 3 |
| 11:30 | 12 | 12 | 8 | 12 | 2 | 1 | 2 |
| 12:00 | 16 | 9 | 15 | 12.5 | 2 | 2 | 2 |
| 12:30 | 17 | 11 | 21 | 14 | 2 | 3 | 2 |
| 13:00 | 21 | 24 | 18 | 22.5 | 3 | 2 | 3 |
| 13:30 | 21 | 13 | 26 | 17 | 3 | 3 | 2 |
| 14:00 | 22 | 16 | 32 | 19 | 3 | 4 | 2 |
| 14:30 | 25 | 36 | 21 | 30.5 | 3 | 3 | 4 |
| 15:00 | 22 | 25 | 18 | 23.5 | 3 | 2 | 3 |
| 15:30 | 14 | 16 | 16 | 15 | 2 | 2 | 2 |
| 16:00 | 24 | 14 | 26 | 19 | 3 | 3 | 2 |
| 16:30 | 25 | 43 | 8 | 34 | 3 | 1 | 4 |
| 17:00 | 0 | 0 | 8 | 0 | 1 | 1 | 1 |
| 17:30 | 3 | 11 | 0 | 7 | 1 | 1 | 1 |
| Total | 281 | 281 | 281 | 18 staff hrs. | 16 staff hrs. | 15.5 staff hrs. |
The data shows that using ‘total customers in store’ is not as accurate a basis for staffing as using the IN counts. Here is why.
For the period 10:30 to 10:59 there were 13 customers in the store. During the next half hour 11:00 to 11:30, 24 people entered the store. If all these people stayed in the store until 11:29, there would have been 37 customers in the store. You would staff for 37 or 4 staff. If the 29 that left during the half hour all left at 11:01, then there were 8 (37-29) customers in the store during the half hour period and you would put 1 staff on the schedule. So which is it, 4 staff or 1 staff? Back to the question: “what constitutes traffic?” for staffing purposes.
Using IN Counts and BEAM counts divided by 2 is more consistent with the reality and predictability of how traffic actually flows and is thus best to use for allocating staff.
So what is the advantage of directional counts? Directional counting is used to count traffic moving from 1 place to another, as in the case of 2 adjoining stores with a pass through from one to the other. It is maintained that directional counts provide a “time in store” index, although the real value of this appears to be more theoretical than practical.
Directional traffic counts are available using the Gazelle products or the 3DScope.


